
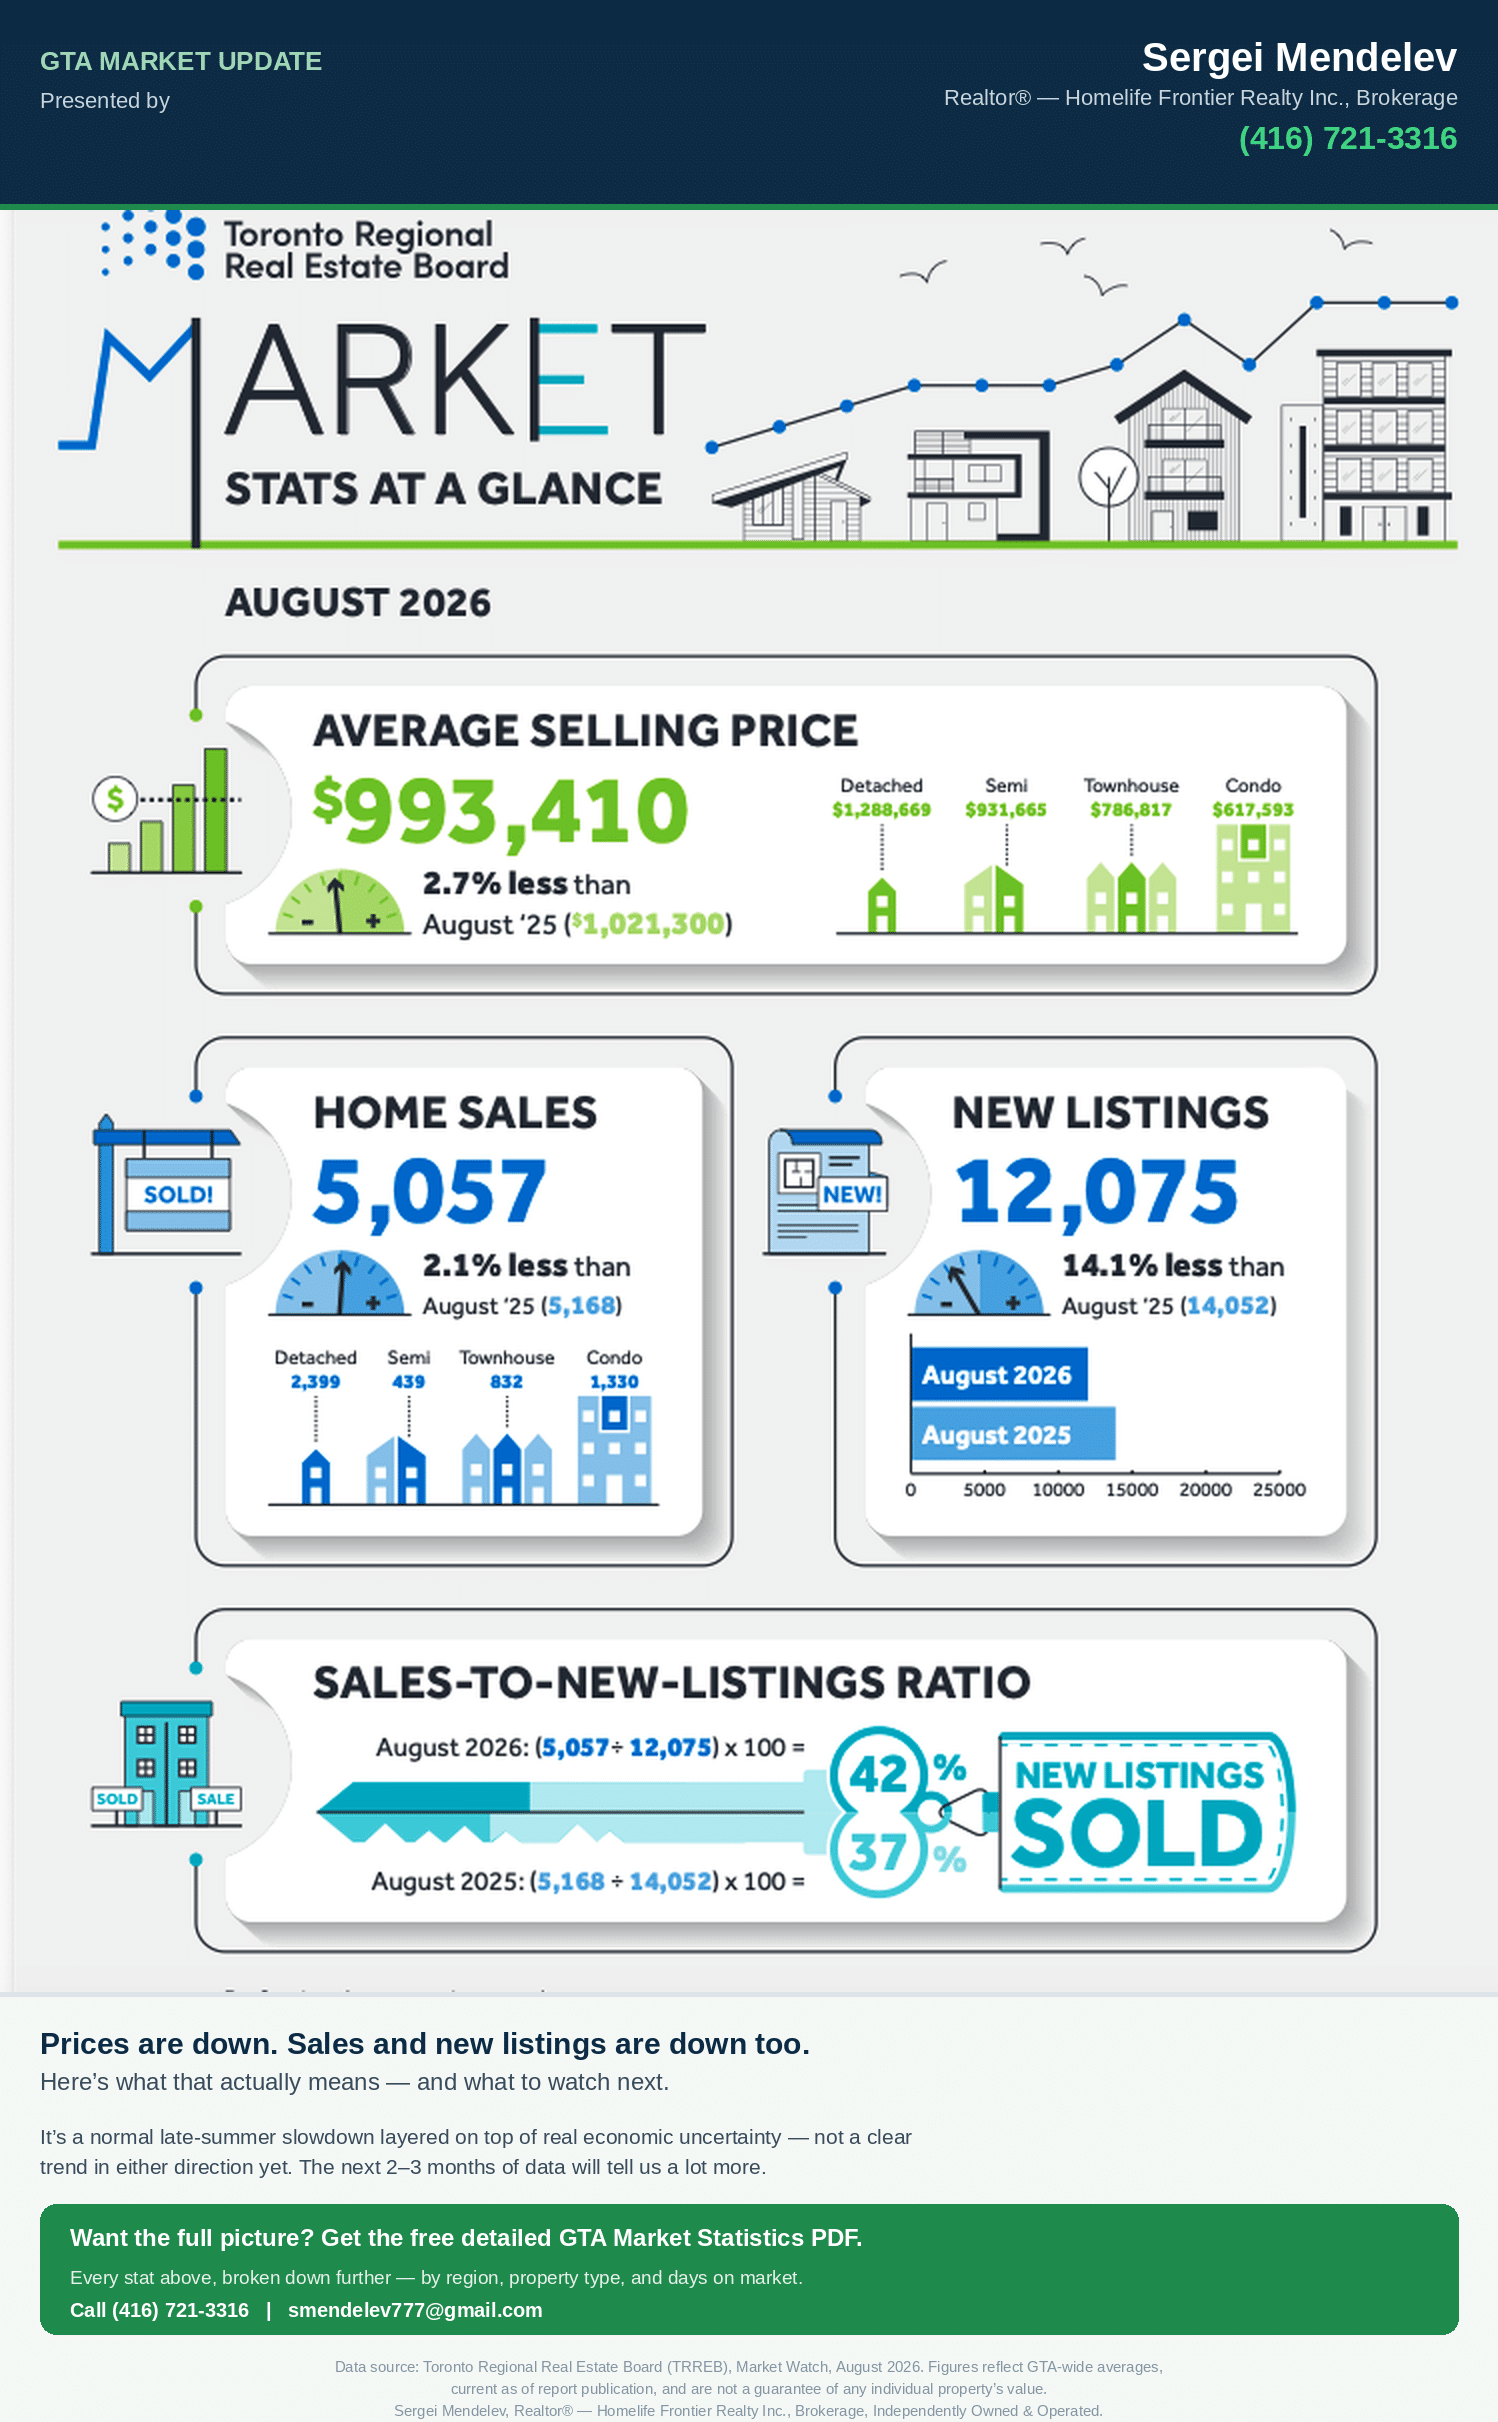
The headline number is straightforward: the average GTA home price came in at $993,410 in August 2026, down 2.7% from $1,021,300 a year earlier. If you stop there, it looks like a simple story of a softening market. The fuller TRREB Market Watch data tells a more layered story — and the layer that matters most right now is that sales and new listings both pulled back at the same time.
The numbers, in full
TRREB reported 5,057 home sales across the GTA in August 2026, down 2.1% from 5,168 a year earlier. By property type:
- Detached: $1,288,669 average (down 1.8% year-over-year), 2,399 sales
- Semi-detached: $931,665 average (down 5.0% year-over-year), 439 sales
- Townhouse: $786,817 average (down 8.6% year-over-year), 832 sales
- Condo apartment: $617,593 average (down 3.6% year-over-year), 1,330 sales
Every property type posted a year-over-year price decline. Sales in the City of Toronto held nearly flat (1,767 sales, down 0.2% year-over-year), while the rest of the GTA saw a steeper pullback (3,290 sales, down 3.1% year-over-year).
New listings totalled 12,075, down a sharper 14.1% from 14,052 the year before, and active listings at month-end sat at 24,482, down 11.3% year-over-year. Homes also took a little longer to sell than last August: the average Listing Days on Market rose to 35 (from 33), and Property Days on Market rose to 51 (from 49).
Why prices, sales, AND listings all sliding together matters
This is the detail worth sitting with: it’s not just that prices are down. Sales are down 2.1% and new listings are down 14.1% — both sides of the market cooled off together. There are two straightforward, non-alarming explanations for that. First, August is reliably the slowest sales month of the real estate calendar year after year — some of this is simply seasonal. Second, there’s genuine economic uncertainty in the background right now: ongoing trade tensions and open questions about where inflation and borrowing costs head next appear to be making both buyers and sellers more cautious about moving.
It’s too early to call this a clear trend in either direction. The next two to three months — historically a more active stretch for the GTA market — will give a much clearer read on whether this is a temporary summer pause or the start of something more sustained.
A regional bright spot worth noting
Not every part of the GTA moved the same amount. York Region — Vaughan, Markham, Richmond Hill, Aurora, Newmarket, and Thornhill — posted an average price of $1,179,938, down just 0.3% year-over-year, by far the smallest decline of any GTA region. Compare that to Simcoe County’s 9.1% decline or the GTA-wide 2.7% decline, and it’s a meaningfully different picture for buyers and sellers in York Region specifically.
What this means if you’re buying
Prices are down and homes are taking a little longer to sell, which can mean less pressure to move fast. But averages are citywide (or region-wide) — your specific neighbourhood and property type can move very differently, as the York Region numbers above show.
What this means if you’re selling
Fewer new listings means less competition from other sellers right now, even with sales also softer. A well-priced, well-presented home in a resilient area like York Region is in a different position than the GTA-wide average suggests.
Get the full picture
Averages only tell part of the story. I’ve put together a free, detailed GTA Market Statistics PDF — the complete breakdown by property type, by region, and days on market, so you can see exactly where your specific area stands rather than just the citywide number. Reply to this post, message me, or call directly to get your copy.
Sergei Mendelev, Realtor® — Homelife Frontier Realty Inc., Brokerage
(416) 721-3316 | smendelev777@gmail.com
Figures above are sourced from TRREB’s official August 2026 Market Watch report and cross-checked against multiple reporting sources; current as of the date of this post. This is not financial or legal advice — always confirm current market conditions before making a buying or selling decision.
